streamR package: Vignette
The streamR package includes a series of functions that give R users access to Twitter's Streaming API, as well as a tool that parses the captured tweets and transforms them in R data frames, which can then be used in subsequent analyses. streamR requires authentication via OAuth and the ROAuth package.
Click here to read the documentation and here to read the vignettes.
Installation and authentication
streamR can be installed directly from CRAN, but the most updated version will always be on GitHub. The code below shows how to install from both sources.
install.packages("streamR")  # from CRAN
library(devtools)
install_github("streamR", "pablobarbera", subdir = "streamR")  # from GitHub
streamR requires authentication via OAuth. The same oauth token can be used for both twitteR and streamR. After
creating an application here, and obtaining the consumer key and consumer secret, it is easy to create your own oauth credentials using the ROAuth package, which can be saved in disk for future sessions:
library(ROAuth)
requestURL <- "https://api.twitter.com/oauth/request_token"
accessURL <- "https://api.twitter.com/oauth/access_token"
authURL <- "https://api.twitter.com/oauth/authorize"
consumerKey <- "xxxxxyyyyyzzzzzz"
consumerSecret <- "xxxxxxyyyyyzzzzzzz111111222222"
my_oauth <- OAuthFactory$new(consumerKey = consumerKey, consumerSecret = consumerSecret,
    requestURL = requestURL, accessURL = accessURL, authURL = authURL)
my_oauth$handshake(cainfo = system.file("CurlSSL", "cacert.pem", package = "RCurl"))
save(my_oauth, file = "my_oauth.Rdata")
filterStream
filterStream is probably the most useful function. It opens a connection to the Streaming API that will return all tweets that contain one or more of the keywords given in the track argument. We can use this function to, for instance, capture public statuses that mention Obama or Biden:
library(streamR)
## Loading required package: RCurl
## Loading required package: bitops
## Loading required package: rjson
load("my_oauth.Rdata")
filterStream("tweets.json", track = c("Obama", "Biden"), timeout = 120,
  oauth = my_oauth)
## Loading required package: ROAuth
## Loading required package: digest
## Capturing tweets...
## Connection to Twitter stream was closed after 120 seconds with up to 350 tweets downloaded.
tweets.df <- parseTweets("tweets.json", simplify = TRUE)
## 350 tweets have been parsed.
Note that here I'm connecting to the stream for just two minutes, but ideally I should have the connection continuously open, with some method to handle exceptions and reconnect when there's an error. I'm also using OAuth authentication (see below), and storing the tweets in a data frame using the parseTweets function. As I expected, Obama is mentioned more often than Biden at the moment I created this post:
c( length(grep("obama", tweets.df$text, ignore.case = TRUE)),
   length(grep("biden", tweets.df$text, ignore.case = TRUE)) )
## [1] 347 2
Tweets can also be filtered by two additional parameters: follow, which can be used to include tweets published by only a subset of Twitter users, and locations, which will return geo-located tweets sent within bounding boxes defined by a set of coordinates. Using these two options involves some additional complications – for example, the Twitter users need to be specified as a vector of user IDs and not just screen names, and the locations filter is incremental to any keyword in the track argument. For more information, I would suggest to check Twitter's documentation for each parameter.
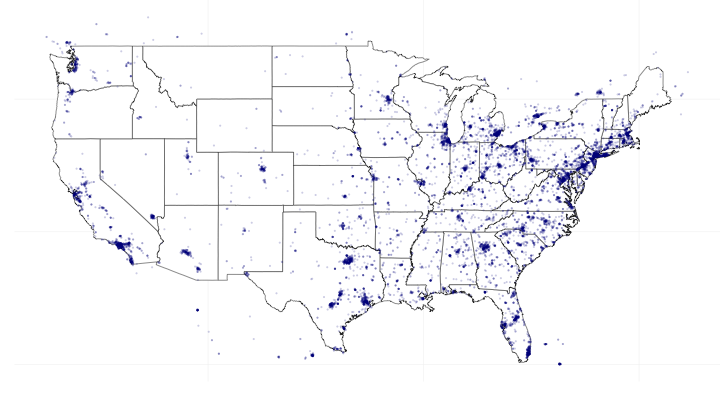
Here's a quick example of how one would capture and visualize tweets sent from the United States:
filterStream("tweetsUS.json", locations = c(-125, 25, -66, 50), timeout = 300,
    oauth = my_oauth)
tweets.df <- parseTweets("tweetsUS.json", verbose = FALSE)
library(ggplot2)
library(grid)
map.data <- map_data("state")
points <- data.frame(x = as.numeric(tweets.df$lon), y = as.numeric(tweets.df$lat))
points <- points[points$y > 25, ]
ggplot(map.data) + geom_map(aes(map_id = region), map = map.data, fill = "white",
    color = "grey20", size = 0.25) + expand_limits(x = map.data$long, y = map.data$lat) +
    theme(axis.line = element_blank(), axis.text = element_blank(), axis.ticks = element_blank(),
        axis.title = element_blank(), panel.background = element_blank(), panel.border = element_blank(),
        panel.grid.major = element_blank(), plot.background = element_blank(),
        plot.margin = unit(0 * c(-1.5, -1.5, -1.5, -1.5), "lines")) + geom_point(data = points,
    aes(x = x, y = y), size = 1, alpha = 1/5, color = "darkblue")
sampleStream
The function sampleStream allows the user to capture a small random sample (around 1%) of all tweets that are being sent at each moment. This can be useful for different purposes, such as estimating variations in “global sentiment” or describing the average Twitter user. A quick analysis of the public statuses captured with this method shows, for example, that the average (active) Twitter user follows around 500 other accounts, that a very small proportion of tweets are geo-located, and that Spanish is the second most common language in which Twitter users set up their interface.
sampleStream("tweetsSample.json", timeout = 120, oauth = my_oauth, verbose = FALSE)
tweets.df <- parseTweets("tweetsSample.json", verbose = FALSE)
mean(as.numeric(tweets.df$friends_count))
## [1] 543.5
table(is.na(tweets.df$lat))
##
## FALSE  TRUE
##   228 13503
round(sort(table(tweets.df$lang), decreasing = T)[1:5]/sum(table(tweets.df$lang)), 2)
##
##   en   es   ja   pt   ar
## 0.57 0.16 0.09 0.07 0.03
userStream
Finally, I have also included the function userStream, which allows the user to capture the tweets they would see in their timeline on twitter.com. As was the case with filterStream, this function allows to subset tweets by keyword and location, and exclude replies across users who are not followed. An example is shown below. Perhaps not surprisingly, many of the accounts I follow use Twitter in Spanish.
userStream("mytweets.json", timeout = 120, oauth = my_oauth, verbose = FALSE)
tweets.df <- parseTweets("mytweets.json", verbose = FALSE)
round(sort(table(tweets.df$lang), decreasing = T)[1:3]/sum(table(tweets.df$lang)), 2)
##
##   en   es   ca
## 0.62 0.30 0.08
More
In these examples I have used parseTweets to read the captured tweets from the text file where they were saved in disk and store them in a data frame in memory. The tweets can also be stored directly in memory by leaving the file.name argument empty, but my personal preference is to save the raw text, usually in different files, one for each hour or day. Having the files means I can run UNIX commands to quickly compute the number of tweets in each period, since each tweet is saved in a different line:
system("wc -l 'tweetsSample.json'", intern = TRUE)
## [1] " 15086 tweetsSample.json"
Concluding...
I hope this package is useful for R users who want to at least play around with this type of data. Future releases of the package will include additional functions to analyze captured tweets, and improve the already existing so that they handle errors better. My plan is to keep the GitHub version up to date fixing any possible bugs, and release only major versions to CRAN.
You can contact me at pablo.barbera[at]nyu.edu or via twitter (@p_barbera) for any question or suggestion you might have, or to report any bugs in the code.